inflation in Iran – inflation or inflame-tion – A forecast using fundamental and political factors
Iran’s Inflation Forecast Results
Iran’s Inflation in different sectors until March 2023:
The inflation rate until the end of March 2023 according to the below table is forecasted at 37.6%[1]
| Forecast | CPI[2] | Industry | PPI[3] | Services[4] |
| By end of March 2023 | 37.6% | 32.3% | 31.1% | 26.5% |
According to Iran’s government budget which was approved in March 2022, the government is expected to face a significant budget deficit, which could increase liquidity and lead to increased inflation. On the other hand, the elimination of the preferred currency rate (in previous years, Iran used a multi-exchange rate to keep food and medicine at lower prices) will lead to an increase in the price of basic commodities (repeating the experience of implying the single exchange rate in the 90s that caused heavy inflations). If there is an agreement between Iran and the United States, we can expect a temporary decrease in the exchange rate, which will reduce the pressure of inflation by reducing the cost pressure, but on the other hand, the increase in demand pressure due to the boom (overflow of oil revenues, release blocked money, and opening up the business environment) can keep inflation high.
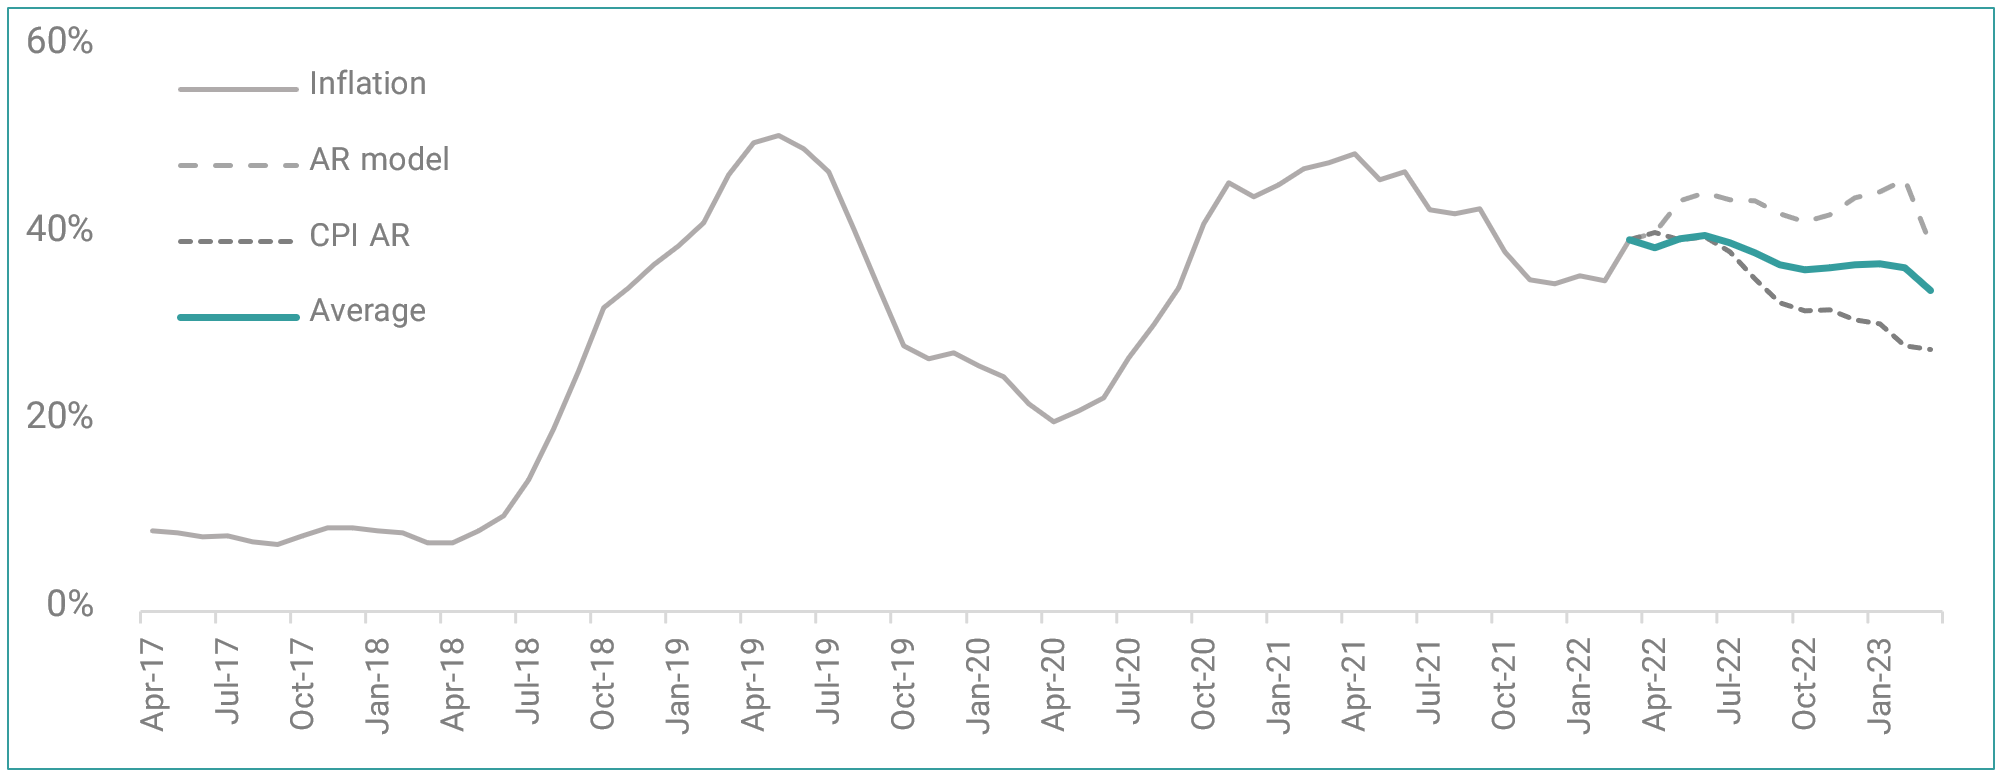
Inflation forecast along with historical inflation – 2017 – 2023
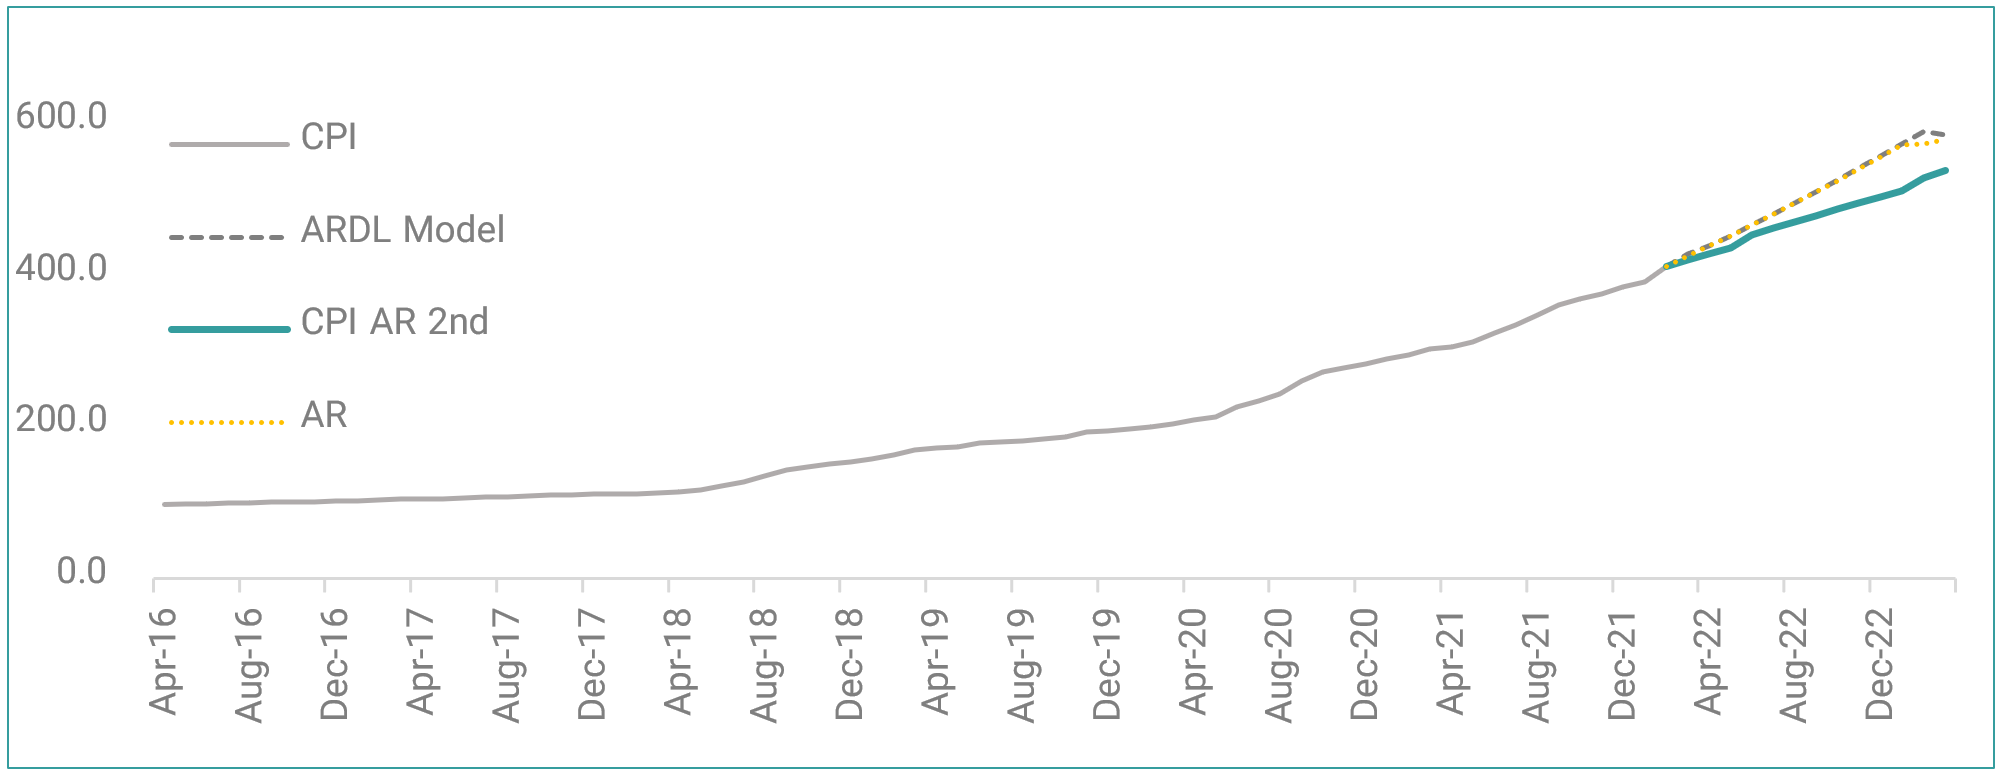
Consumer price index – 2016-2023 (base year 2016)
A Brief History of Inflation in Iran
According to data published by the Statistics Center of Iran[5], consumer price indices and inflation rates from 1970 to 2022 are as shown below. The average for the whole period is 16%, the average inflation before the 1979 revolution is 11.5% and the average after the 1979 revolution is 20.6%.
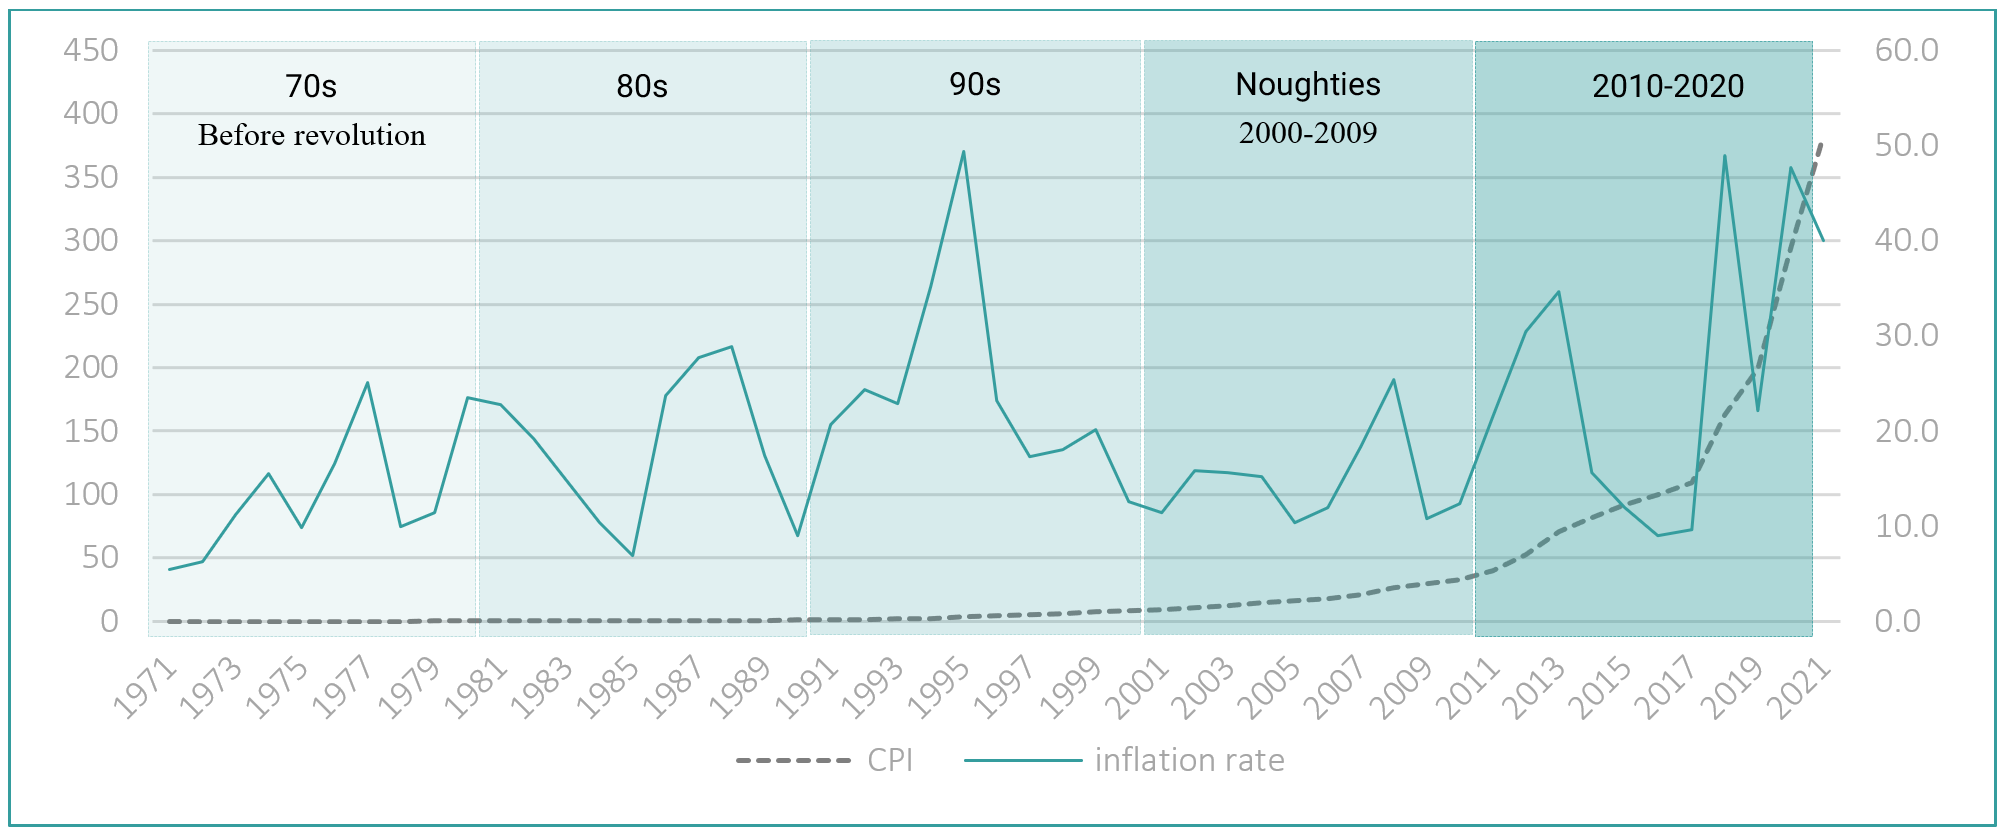
historical data of inflation and CPI in Iran
The sixties: 1960-1969
The study of the inflation situation in Iran has shown the relative stability of inflation until the 1960s. After the implementation of the Third Development Plan in the mentioned decade and the adoption of the import substitution policy, new changes in the economy began. Due to the increase in revenues from oil exports, on the one hand, and the adoption of incorrect policies in the optimal use of oil revenues, on the other hand, the economy was out of relative equilibrium and while achieving higher growth rates, inflation also increased sharply.
The seventies: 1970-1979
From the early 1970s until the Revolution of 1979, as a result of rising oil revenues, the country first encountered a phenomenon referred to in the economic literature as the Dutch disease. The result of this disease for the country was an increase in government spending and aggregate demand, which led to severe inflation.
After the Islamic Revolution, in 1980 and 1981, the effects of inflation due to the government budget deficit and the pressures of reducing production and increasing prices of imported raw materials, due to economic sanctions and the Iraq war appeared.
The eighties: 1980 – 1989
In 1982, increasing government revenues from increasing oil exports and reducing foreign exchange restrictions, imports of consumer and intermediate & capital goods, and the implementation of inflation reduction, caused lower inflation. Then the sharp drop in oil prices in 1986 reduced the government’s foreign earnings dramatically. The sharp decline in foreign earnings first reduced the volume of imports and then manifested itself in a sharp decline in production. On the other hand, the sharp increase in liquidity to cover the budget deficit, which was 46% of the total budget this year, raised the inflation rate, which was about 7% in 1985, to 23.7%. The government budget deficit increased sharply during these years so in 1988, the budget deficit ratio reached 50%[6] in 1988. During the years 1988-1990, the Iranian economy went through a short period of stability.
The nineties: 1990-1999
Unfortunately, the implementation of economic adjustment policies, the overdue debts crisis, and the policy of single exchange rate of the country faced severe inflation from 1994 to 1998. in the years of the Iraq war (1980 – 1988), the impact of war costs and the sharp decline in oil revenues, the decline of taxes, the severe budget deficit, and the government’s borrowing from the central bank caused high inflation. But in the nineties, increase oil revenues, foreign loans, and ignoring the experience of 1974-1978 created rampant inflation.
After 1997, the growth trend of liquidity decreased, and then until 2001, the inflation rate also decreased and reached 11%.
The noughties: 2000-2009
By the end of 2005, the jump in liquidity and inflation was controlled and these indicators began to decline. Following the monetary policies implemented and controlling the consequences of the exchange rate unification policy, at the end of 2005, the inflation rate reached 10%.
Since 2007, the exchange rate has been accompanied by severe and irregular fluctuations, which have largely originated from the country’s political climate and sanctions imposed on various economic sectors. These bottlenecks increased the inflation rate in 2007. From 2007 to 2010, the country’s inflation trend has been relatively stable.
2010-2019
In this decade, the government was in the hands of the moderates, which coincided with Trump’s presidency in the United States and the rise of the Republicans. During these ten years, the main goal was to lift international sanctions and focus on economic openness. Due to the pressure of sanctions, oil sales in this period were low and the major budget deficit in this period was through the sale of financial resources. The exchange rate increased more than 7 times (740%) in this decade and reached about 27,000 Tomans from 3,500 Tomans[7]. One of the most important events in this period is the liberalization of gasoline prices. In the final years of this period, the Coronavirus engulfed the global economy and Iran.
Story of Inflation and Definitions
The story of today’s inflation
In the past, before the 20th century, if prices went up, (for reasons such as war, changes in gold and silver reserves) they would fall in the next period and usually return to previous levels. But in the twentieth century, right after the abolition of the Bretton Woods regime in 1971, inflation was no longer the same.
From the middle of the thirteenth century to the end of the fifteenth century, despite fluctuations in prices, their general and long-term trend has been stable. From the beginning of the 16th century, following the discovery of the Americas and the arrival of significant amounts of gold and silver in Europe, and the relative devaluation of gold and silver, prices rose.
The upward trend in prices stopped at the beginning of the seventeenth century. From this period until the middle of the eighteenth century, although prices fluctuated widely, its long-term trend remained stable. The rise in prices, which began in the late eighteenth century, turned into sharp inflation with the French Revolution and the subsequent Napoleonic Wars. After peace was restored in Europe, prices returned to their original levels in the late eighteenth century.
With the outbreak of World War I, prices rose sharply, but with the end of the war, prices also fell. Prices skyrocketed after World War II and the heavy costs of rebuilding devastated Europe, as well as after the devastation of the Korean War. With the beginning of the 1970s (which coincided with the abolition of the Bretton Woods regime) and the rise of severe inflationary pressures, the issue of inflation in these countries became one of the most important economic issues. Because this time inflation was different from the previous ones.
In the past, if prices increased in one period, they would decrease in another. But prices never wanted to fall during this period. Therefore, one of the important and fundamental goals of all policymakers and economic officials was to achieve a balanced level of prices, which will both contribute to economic growth and ensure the stability of economic growth.
The spread of the phenomenon of inflation and its destructive effects led to many kinds of research on recognizing the causes of occurrence and its effects on other economic indicators and finally providing solutions to deal with it. In the paper money era, from its inception to the early twentieth century, having gold backing and convertibility was the first principle, and governments have worked hard to preserve it. However, this has not always been possible for them and in some cases, they have violated it.
Definition of Inflation
Inflation has several definitions, but:
By nature, it is called the constant increase in the general level of prices.
According to the effect, it is the process of continuous devaluation of money over time.
Also, a steady increase in the general level of prices over a period of time can be the most comprehensive definition of inflation.
The modern concept of inflation became popular in the nineteenth century. Previously, there was another concept of inflation that was used to indicate an increase in the volume of non-gold convertible banknotes.
Inflation is equal to a change in a price index, usually the Consumer Price Index (CPI).
Point-to-point inflation
Point-to-point inflation is obtained by examining the price index of consumer goods and services in each month compared to the same month of the previous year. For example, the March 2023 price index (weighted average household basket price) is compared to the price index of the same period last year, the price index in March 2022, which is called point-to-point inflation. Point-to-point inflation is a global standard that is calculated and announced by many countries.
Factors affecting inflation
Monetary theory
According to monetary theory, inflation is a monetary phenomenon in the long run, meaning that inflation is due to the growth of the nominal money supply (growth of the money supply).
Demand pressure
According to Keynesian theories, in conditions of full employment (lack of idle capacity), demand pressure can increase price levels. It should be noted that the economic situation in Iran is not full employment and it’s in a state of stagflation.
Cost pressure
This theory traces the roots of inflation in rising production costs and the price of production inputs. Contrary to the demand pressure theory, this theory can explain the phenomenon of stagflation inflation and considers it as a result of increasing production costs and moving the total supply curve upwards (increasing inflation).
Six main factors of inflation
In general, the variables affecting the inflation rate can be listed as follows:
| Major Factors Shaping the Inflation (theoretical basis) | |
| ü Changes in liquidity volume (monetary theory) | ü Exchange rate changes (cost pressure, expected inflation) |
| ü Government spending or budget deficit (demand pressure) | ü Labor wage index (cost pressure) |
| ü Bank interest rates (cost pressure) | ü World crude oil prices (demand pressure) |
Examining the history of inflation in Iran, we find that inflation in Iran is largely monetary and it’s affected mostly by liquidity changes, crude oil prices, and exchange rates, and the effect of other factors have lower degrees of impact.
Relation of variables
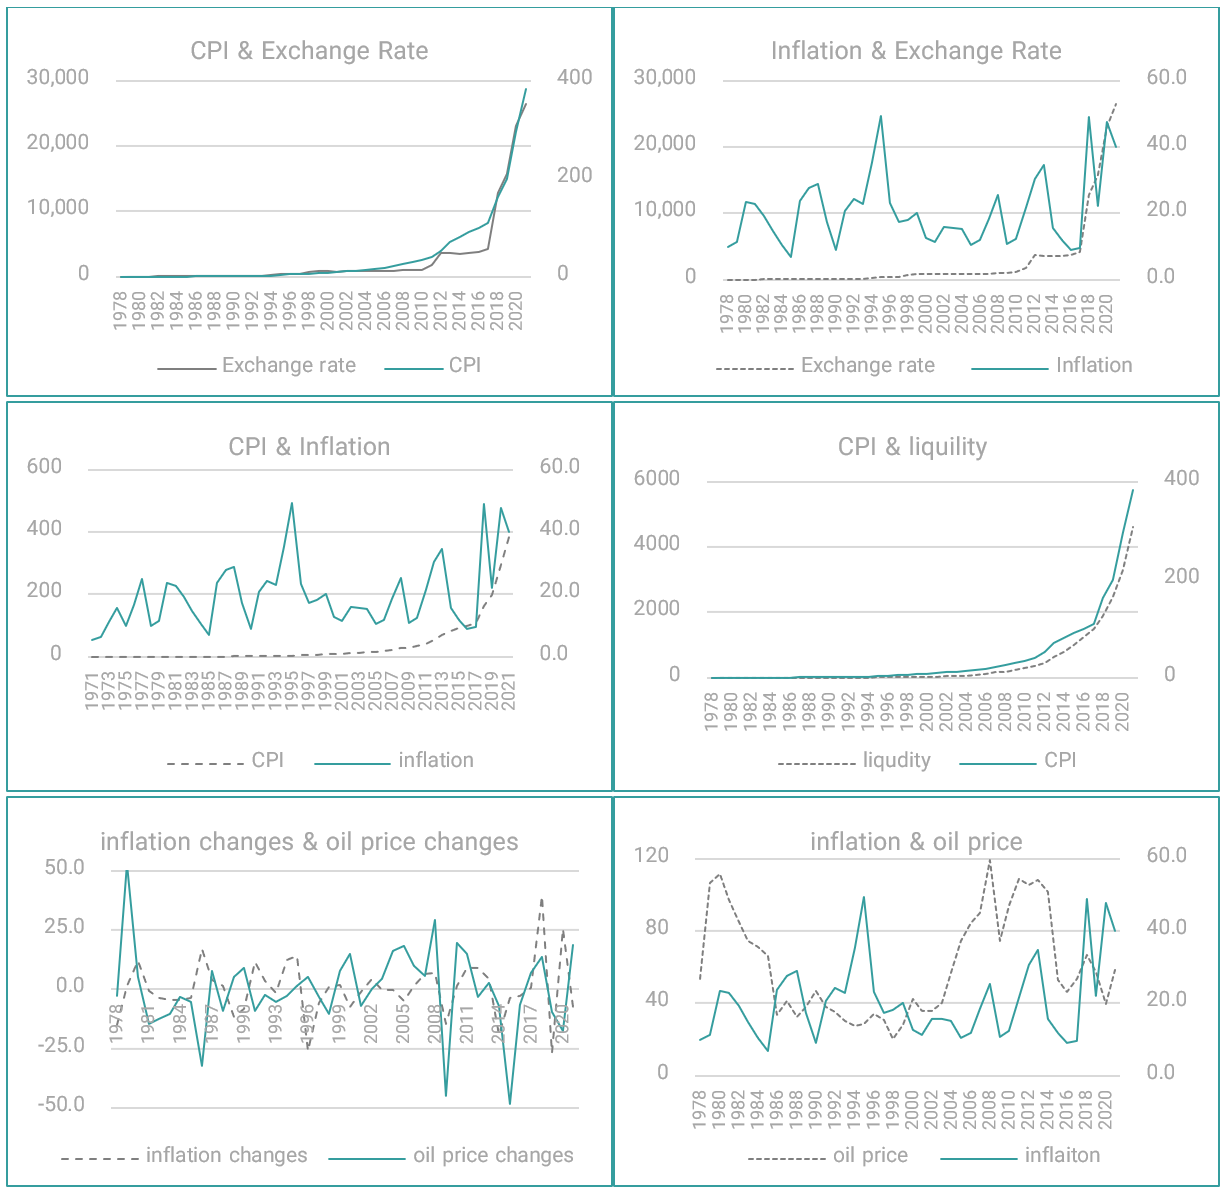
major factors of inflation in Iran
Currency and crude oil price changes.
According to the study of variables, inflation is most affected by liquidity, exchange rates, and changes in crude oil prices.
Liquidity has been increasing steadily (historically due to the government budget deficit and lack of sufficient revenues) which has led to rising consumer price indexes and inflation. Contrary to theories, the increase in oil revenues has not led to a decrease in prices; It can be concluded that the increase in oil revenues has increased the price level by creating demand pressure.
[1] Data and calculations in Excel file
[2]Consumer Price Index
[3] Producing Price Index
[4] Including wages
[5] https://www.amar.org.ir/english
[6] budget deficit to the total budget
[7] One Toman equals 10 Rials.
Be sure to read the following: